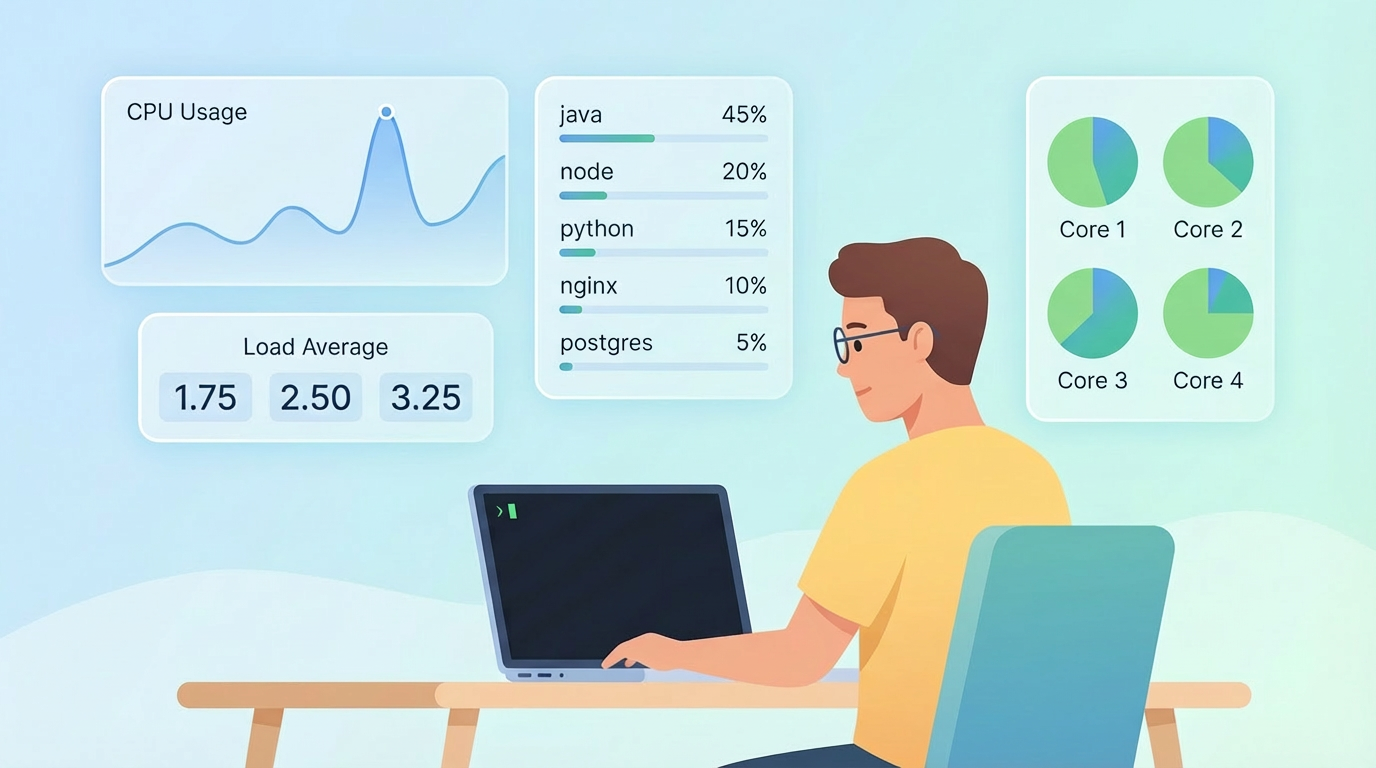
“CPU at 90%! Check immediately.”
If you’re a Linux admin, you’ve definitely heard this.
And the moment that alert fires, everyone suddenly remembers your name:
- “Is the system down?”
- “Does it affect production?”
- “When will it be fixed?”
You log in, open top, stare at the screen refreshing every second…
and still have no idea why the CPU is high.
The CPU looks like it’s burning, but the truth is often hiding somewhere else.
Table of Contents
The Real Reason You Can’t Find the Root Cause
Most admins make the same mistake:
They treat top as the only source of truth.
They see a high %CPU and immediately assume:
- “Machine is overloaded.”
- “We need to scale up.”
- “Something is eating CPU cycles.”
But top only shows symptoms, not causes.
See also: Mastering the Linux Command Line — Your Complete Free Training Guide
In real incidents, CPU issues are often not CPU issues at all. They’re caused by:
- I/O wait (the CPU is idle, stuck waiting for slow disk/NAS/cloud storage)
- Context switching storms (too many threads fighting for time slices)
- Steal time in virtualized environments
- One misbehaving process that bursts for seconds and disappears
So the frustration is understandable:
You’re being asked “Why?” while your tools only tell you “What.”
The 3-Step CPU Diagnosis Flow I Use in Real Incidents
This is the exact process I use when a sudden CPU spike hits.
It’s fast, systematic, and works on any Linux server or cloud VM.
Step 1 — Identify What Kind of “High CPU” It Is
Run:
vmstat 1 5
This instantly tells you the real reason behind the spike.
ushigh → user processes are truly busysyhigh → kernel is busy (system calls, interrupts)wahigh → the CPU is waiting on disk I/Osthigh → hypervisor is stealing CPU time
Most people ignore wa—but that’s where half of the problems hide.
True story:
I once had a VM alerting at 95% CPU.
Turned out, the application wasn’t the problem—the cloud disk backend was throttled.
CPU was “high” simply because it was stuck waiting.
Step 2 — Reconstruct What Happened Before You Logged In
By the time you ssh into the VM, the spike may be over.
This is where sar becomes gold.
Check historical CPU states:
sar -u 1 5
Or load data from the daily logs:
sar -u -f /var/log/sa/sa10
Why this matters:
Most monitoring systems sample every 1–5 minutes.
If the spike happened 20 seconds ago, you won’t see it without sar.
You get a timeline:
- When did CPU jump?
- Was it a one-time burst?
- Was it caused by user load, system load, or I/O wait?
This transforms you from “guessing admin” to “investigative admin.”
Step 3 — Identify Which Process Actually Caused the Issue
Now that you know how the CPU was busy, find who was responsible.
Start with:
ps -eo pcpu,pid,user,args | sort -k1 -r | head
If CPU is busy switching tasks or threads, use:
pidstat -wt 2 5
Why pidstat?
Because it exposes something top cannot: context switches.
A process with high cswch/s can make the entire box feel slow
—even when its %CPU looks normal.
This is how you catch “ghost bottlenecks.”
A Real Case: CPU at 100%, But the CPU Wasn’t the Problem
One of our production VMs got a critical alert:
CPU Usage: 98% Load Average: 12.0
Business team panicked.
App team demanded immediate root cause.
When I logged in, CPU was only around 40%.
So what happened?
Here’s what the tools revealed:
vmstat:wa> 60%sar: spike started exactly when a backup job triggeredpidstat: backup process causing massive I/O- Disk metrics: IOPS capped due to cloud disk limits
Root cause:
The disk backend throttled, causing I/O wait,
making the CPU look “busy” even though it was actually idle.
We moved the backup to an off-peak time.
CPU alerts stopped completely.
This is why understanding how CPU is busy is more important than how much.
Final Thoughts: CPU Alerts Aren’t Problems — They’re Signals
A CPU spike doesn’t mean your machine is dying.
It just means something changed.
What separates junior admins from experts isn’t how many commands they know—
it’s how they interpret what the system is telling them.
Next time you see “CPU 100%”:
- Check the type (
us,sy,wa,st) - Check the timeline (
sar) - Identify the culprit (
ps/pidstat)
Stay calm, focus on the signal, and the system will tell you exactly where to look.


