This article is part of the following series.
- 6 performance tools you should know in Linux
- 5 Ways to Check disk size in Linux
- 4 Ways to Check Disk Partition with Examples in Linux
- How I Fixed a disk performance issue in Minutes – A Step by Step Guide to Optimize Linux System
Iotop is an interactive real-time I/O usage monitoring tool to check disk read and write bandwidth usage for each running process on Linux. Iotop is very useful to troubleshoot disk performance issues on Linux.
We can easily find out which process is generating workload to our disks. Let us check out how to use iotop.
- Install iotop on CentOS/Redhat Linux
- Install iotop on Ubuntu Linux
- How to use iotop on Linux
- Check Total IO Usage Per Process
- Check Process ID instead of TID in iotop
- Filter by Process id or username in iotop
Table of Contents
Check disk io usage per process with iotop command in Linux
iotop is a Linux command that allows you to see the I/O usage of processes in real time. To use iotop, open the terminal and type sudo iotop. The output will show information about the currently running processes and their I/O usage. Press q to exit the command.
To see I/O usage for a specific process, type sudo iotop -p PID, where PID is the process ID. To see I/O usage for a specific block device, type sudo iotop -b -d DEVICE, where DEVICE is the block device name.
iotop can be helpful in diagnosing performance issues. If a process is using a lot of I/O, it may be causing slowdowns on the system. By identifying the processes that are using the most I/O, you can focus on optimizing those processes.
Related: 3 ways to check disk performance in Linux
Install iotop on CentOS/Redhat Linux
iotop is available in the official package repository of CentOS/Redhat. We can easily install it with the YUM package manager as follows:
See also: Mastering the Linux Command Line — Your Complete Free Training Guide
$ sudo yum install iotop -y
Install iotop on Ubuntu Linux
$ sudo apt update

$ sudo apt install iotop
How to use iotop on Linux
We can use the following useful shortcuts for iotop command.
- Hit the left and right arrow keys to change the sorting.
- Hit r to reverse the sorting order.
- Hit o only to see processes or threads actually doing I/O, instead of showing all processes or threads.
- Hit p only show processes. Normally iotop shows all threads.
- Hit a display accumulated I/O instead of bandwidth. In this mode, iotop shows the amount of I/O processes have done since iotop started.
- Hit i to change the priority of a thread or a process’ thread(s) i.e. ionice.
- Hit q to quit iotop.
The “total” values show the amount of data read from or written to the disk block device driver, and the “actual” values show the numbers for the actual hardware disk I/O.
File system caching is one of the reasons for the difference in the values.
Check Total IO Usage Per Process: $ sudo iotop -ao
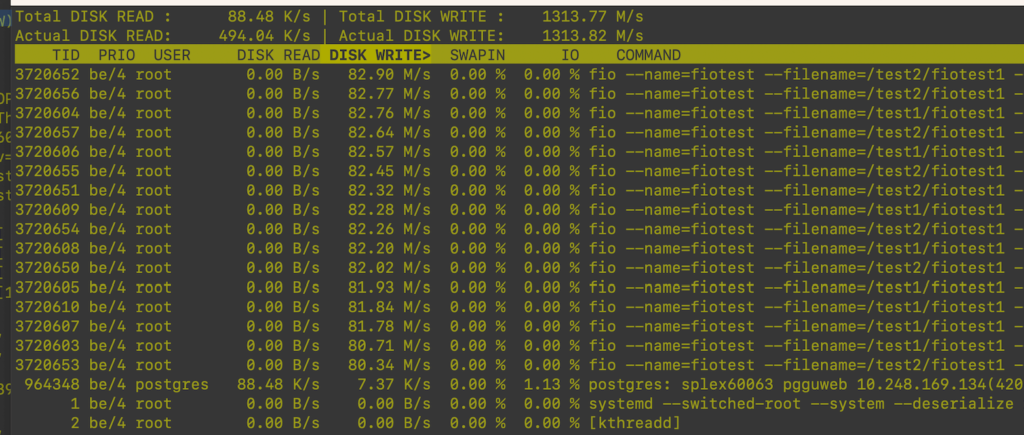
Check Process ID instead of TID in iotop :$ sudo iotop -P
This is an example I used to test the volume performance with fio command. There are 16 fio processes. Each process can reach 82MB/s.
Filter by Process id or username in iotop
- $ sudo iotop -P -p 110 -p 112
- $ sudo iotop -P -u howtouselinux1 -u howtouselinux2
What are some common issues with disks in Linux?
- Disks can fill up quickly, especially if they are not properly monitored.
- Disk I/O can be a bottleneck for performance.
- Incorrectly configured permissions can lead to security issues.
- Improperly mounted disks can cause data loss.
- Incompatible filesystems can cause data corruption.
How can I prevent issues with my disks in Linux?
- Use a tool like du or df to check disk usage and monitor for unusual spikes.
- Use a tool like iotop to monitor disk I/O and identify processes that are using a lot of I/O.
- Make sure permissions are properly configured on all disks.
- Always unmount disks before powering down the system.
- Use a compatible filesystem for all disks.
Related Post: