
I’ve been there—faced with a Linux server that’s slower than molasses in winter. It’s a headache, but it’s a common one. Fortunately, after many late nights and countless cups of coffee, I’ve honed a few strategies to get my server back up to speed. Let me take you through my troubleshooting journey.
Table of Contents
How I Check the Load Average
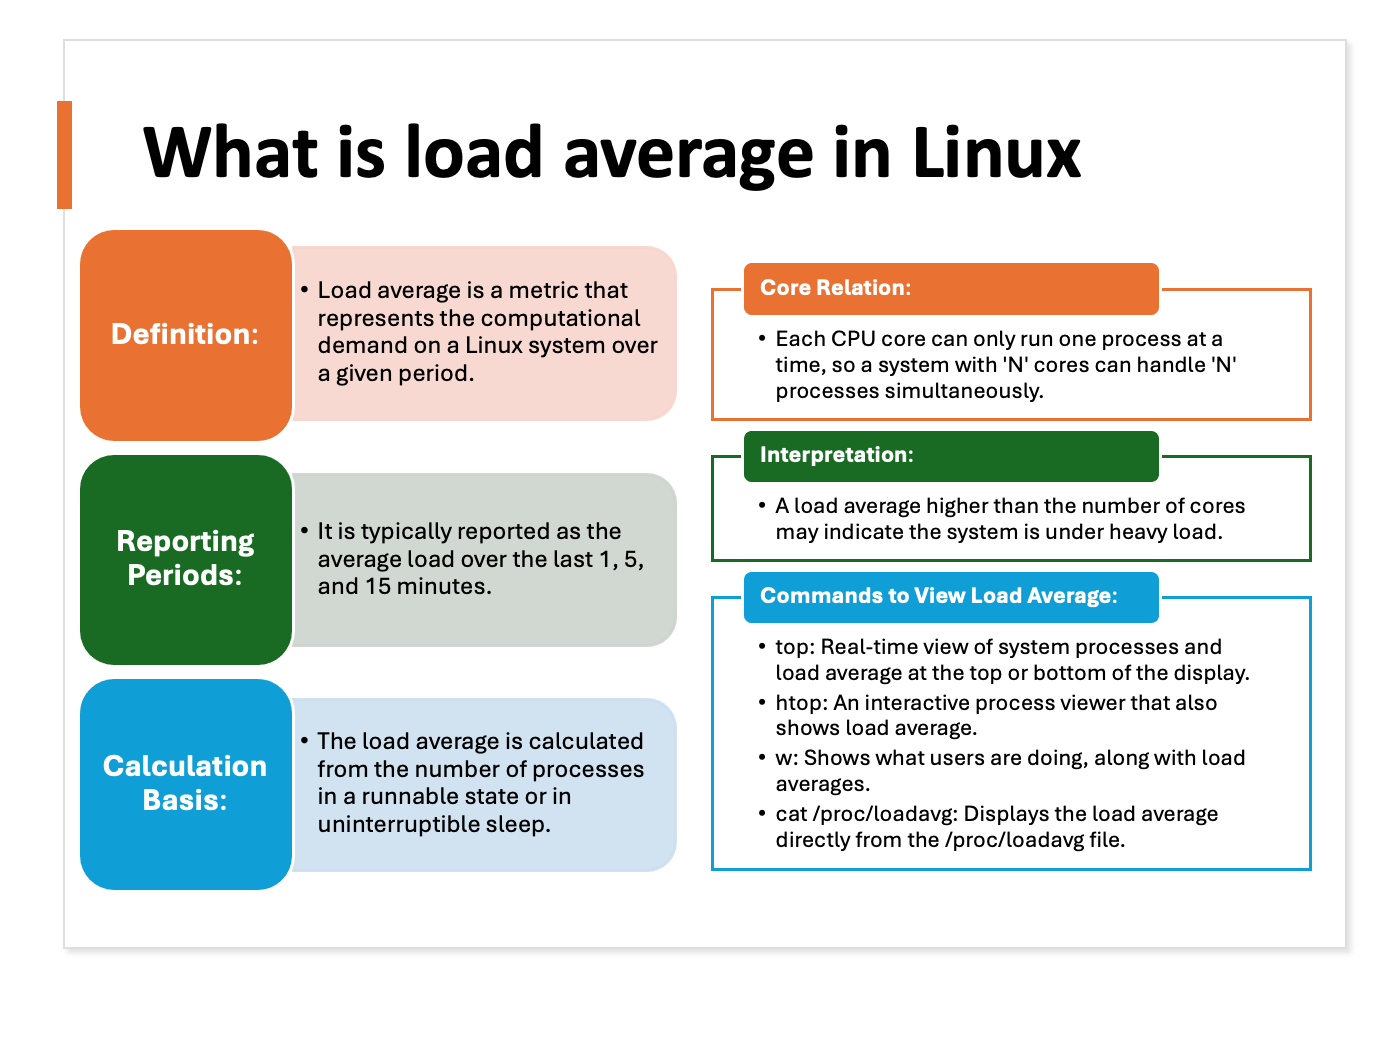
When I suspect my server is lagging, the first stop is always the load average. This metric gives me a clear sense of the processing power my server is consuming. A high load average screams stress, which is often the culprit behind sluggish performance.
I check this using the top command, which not only shows the current load averages but also lists the resource-hogging processes. For a more digestible format, I look at the /proc/loadavg file.
When it comes to understanding load averages, I’ve learned that these numbers are specific to the system and are closely tied to the number of cores my server possesses.
On a multi-core system, I keep an eye out for a load average that exceeds the number of cores. For instance, on a quad-core server, if I see a load average consistently above 4, it raises a red flag for me. This could mean that the processes are competing for CPU time and are unable to complete their tasks efficiently.
If the load average is pinging the roof, I have a couple of go-to moves. I scrutinize the list of processes to pinpoint those that are using a significant amount of CPU or memory. These are often the primary contributors to a high load average.
If I discover any non-essential processes that are consuming excessive resources, I don’t hesitate to terminate them using the kill command followed by the process ID, which helps free up resources immediately.
For critical processes that are resource-intensive, I delve deeper to understand why they are demanding so much.
In cloud-based setups, I take advantage of the ability to scale out by provisioning additional instances to share the load.
See also: Mastering the Linux Command Line — Your Complete Free Training Guide
How I Tackle Disk IO Issues

I’ve come to realize through experience that disk I/O issues can significantly impede my server’s performance. It’s akin to a traffic jam that slows down the flow of data, leading to sluggish system responsiveness.
To proactively monitor disk I/O, I utilize the iotop command, which provides a real-time view of the processes that are most heavily impacting disk activity. This tool is invaluable for spotting processes that are consuming excessive I/O resources. When I identify such a process, I have to make a quick decision: either terminate it if it’s not critical, or delve deeper to understand why it’s using so much resources.
In addition to iotop, the iostat command serves as another powerful tool in my toolkit. It offers a comprehensive breakdown of my system’s disk activity, including idle times, as well as read and write statistics. This level of detail helps me understand the performance characteristics of my storage systems and identify when they become a bottleneck.
When I determine that disk I/O is indeed the bottleneck, I have a couple of strategies to alleviate the issue. One approach is to increase the number of disks in my system, which can help reduce contention for resources and improve overall I/O throughput. Alternatively, I might consider upgrading to faster disk interfaces such as SSDs, which offer much quicker read/write speeds compared to traditional hard drives.
Another aspect I consider is the file system I use. Different file systems have different performance characteristics, and choosing the right one for the job can make a noticeable difference. For example, ext4 is a versatile file system that works well for many use cases, while XFS or Btrfs might offer better performance for specific workloads.
How I Diagnose Memory Leaks
I’ve learned through experience that memory leaks can insidiously degrade server performance. They occur when a process consumes more memory than necessary and fails to release it, potentially leading to memory exhaustion and the detrimental effect of swapping to disk.
To detect memory leaks, I rely on the top command as my primary tool. It provides a dynamic, real-time view of memory usage, highlighting processes that are consuming an excessive amount of memory. When I identify a process that’s gorging on memory, I have to decide whether to terminate it immediately or investigate further to understand why it’s behaving this way.
In addition to top, the free command gives me a comprehensive overview of my system’s memory landscape. It shows me not just the total and used memory, but also the amount of memory that’s free or cached, which is crucial for understanding the overall memory health of my server.
Once I’ve identified a memory leak, my response is decisive: I either kill the offending process if it’s not critical and can be restarted, or I plan a server restart to reset the memory usage and clear any leaks that have occurred.
I also employ the ps command to list processes and their detailed memory usage, which can help me track down processes that are leaking memory. The ps command, combined with options like -e for all processes or -p for specific process IDs, gives me a snapshot of memory consumption that can be correlated with the findings from top.
For a more detailed analysis, I use the pmap command on the suspected process to get a map of its memory usage. This can help me understand what parts of the process are using the most memory.
If the memory leaks are persistent and seem to be related to specific applications, I check the application logs and configuration files for any known issues or recommended memory usage settings.
How I Probe Network Issues
When facing network issues on a Linux system, I start by verifying network configurations using the ifconfig or ip addr show commands to ensure that each interface is correctly set up with the appropriate IP address, netmask, and broadcast settings.
Next, I delve into the system logs. By examining /var/log/syslog, /var/log/messages, or utilizing the journalctl command, I search for any error messages that might indicate what’s going wrong with the network.
I also use netstat and ss to get a detailed view of open ports, active connections, and routing tables. These tools are instrumental in identifying any network-related issues that could be affecting connectivity.
DNS resolution is another critical aspect I check using nslookup or dig. Ensuring that domain names resolve correctly to IP addresses is essential for diagnosing network problems.
Firewall rules can sometimes be the culprit, so I review them with iptables -L or firewall-cmd --list-all. It’s important to make sure that no rules are inadvertently blocking necessary network traffic.
If I suspect a problem with network services, I check their status and configuration using systemctl status or service commands. This helps me confirm that services like SSH, HTTP, FTP, and others are running smoothly and listening on the correct ports.
Physical connections and hardware are also on my radar. I verify that all network cables and hardware components, such as switches and routers, are functioning correctly and are properly configured.
For a deeper analysis, I might employ tcpdump or wireshark to capture and analyze network traffic, looking for anomalies or issues that could be causing the network problems.
By taking these steps, I can thoroughly investigate and address most network-related problems on a Linux system, ensuring that my server maintains optimal performance and connectivity.
These strategies have helped me sidestep the pitfalls of a slow Linux server. By troubleshooting and addressing these common issues, I keep my server running like a well-oiled machine. Thanks for joining me on this journey, and I hope these insights help you navigate your own server-speed sagas!


Thanks for the sharing. You are the best.