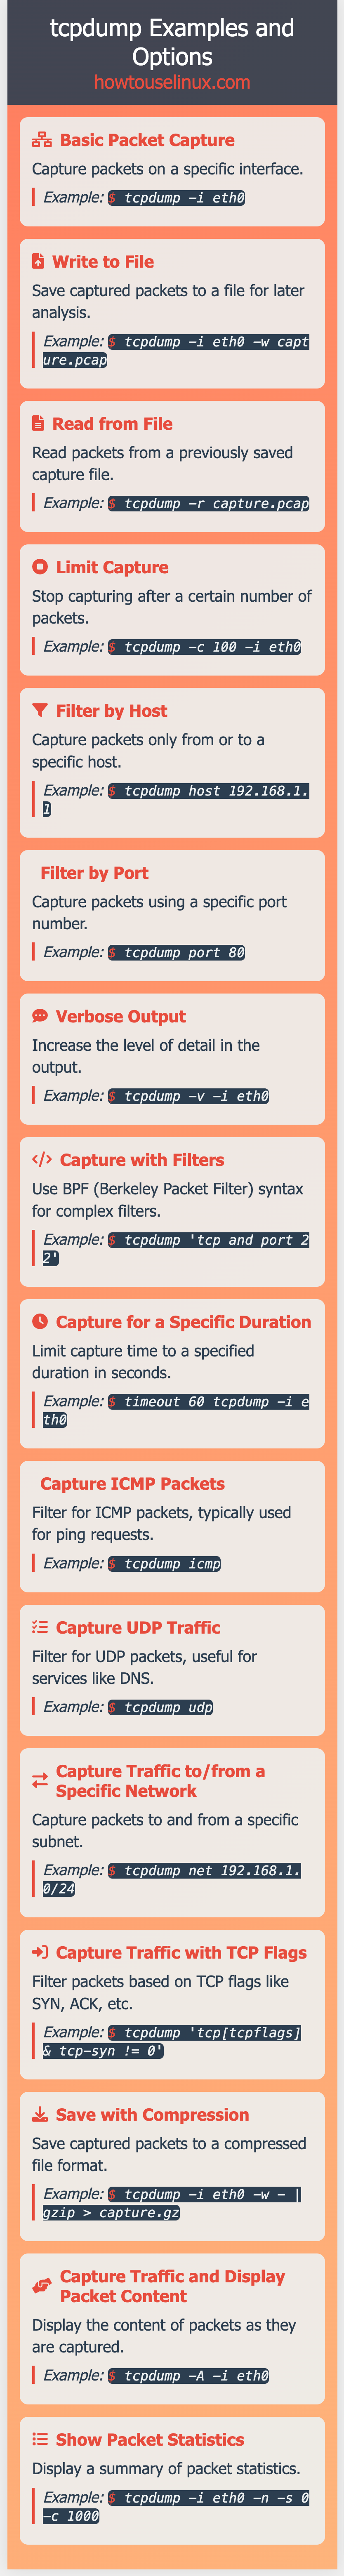
When network issues strike, tcpdump is often the first tool professionals reach for. It’s like a microscope for your network — allowing you to see every packet traveling in and out of your system.
But without filters, tcpdump captures everything, flooding your terminal with data you don’t need. That’s where filters come in: they help you capture only what’s relevant.
This guide walks you through tcpdump filters, common options, and practical examples — so you can quickly isolate problems, monitor network behavior, and capture just the right data.
Table of Contents
1. What Are Tcpdump Filters?
Tcpdump filters determine which packets are captured or displayed. They’re based on the Berkeley Packet Filter (BPF) syntax, which gives tcpdump its precision and speed.
There are three main categories:
🧩 Keyword Filters
A keyword filter lets you capture packets based on attributes like host, port, or direction (source/destination). It’s perfect for quick and direct filtering.
Examples
# Capture packets from or to a specific host
tcpdump host 192.168.0.5
👉 Captures all packets either sent from or received by the host 192.168.0.5.
Useful when you’re troubleshooting communication between your system and a single IP.
# Capture packets only from a specific source
tcpdump src 192.168.0.10
👉 Focuses on outbound traffic — packets originating from 192.168.0.10.
This helps verify whether a host is sending data as expected.
See also: Mastering the Linux Command Line — Your Complete Free Training Guide
# Capture packets going to a specific destination
tcpdump dst 10.0.0.2
👉 Filters inbound traffic directed to 10.0.0.2.
Great for diagnosing if packets are reaching a certain target or application server.
# Capture packets on a specific port (e.g. HTTPS)
tcpdump port 443
👉 Limits output to traffic on TCP/UDP port 443.
Ideal for inspecting HTTPS traffic or verifying secure connections.
⚙️ Expression Filters
Expression filters combine multiple conditions using logical operators like and, or, and not. These are essential when you need fine-grained control.
Examples
# Capture packets from a host AND on a specific port
tcpdump src 192.168.0.10 and port 22
👉 Captures only SSH traffic (port 22) from that source IP.
Handy for verifying SSH connectivity or detecting unauthorized access.
# Capture packets from one host OR another
tcpdump src 192.168.0.10 or src 192.168.0.11
👉 Lets you monitor multiple sources at once.
Perfect when comparing behavior between two servers or load-balanced nodes.
# Capture everything EXCEPT ICMP traffic
tcpdump not icmp
👉 Filters out ping (ICMP) packets to focus on TCP/UDP traffic.
Useful when ICMP packets clutter your capture during diagnostics.
🌐 Protocol Filters
A protocol filter tells tcpdump to capture only specific network protocols.
These are handy when troubleshooting at a particular OSI layer.
Examples
# Capture only TCP packets
tcpdump tcp
👉 Focuses on TCP traffic such as HTTP, SSH, or SMTP.
Helpful for checking retransmissions or connection resets.
# Capture only UDP packets
tcpdump udp
👉 Captures DNS queries, streaming packets, or other UDP-based traffic.
Use this to debug DNS lookup failures or latency in UDP apps.
# Capture only ICMP packets
tcpdump icmp
👉 Displays only ICMP traffic (like ping).
Perfect for testing host reachability or diagnosing packet loss.
2. Common Tcpdump Options
Filters define what to capture; options define how tcpdump behaves.
Here’s a quick reference table:
| Option | Description |
|---|---|
-i | Listen on a specific interface (e.g. -i eth0). Use -i any for all interfaces. |
-n | Don’t resolve hostnames or service names (faster, clearer). |
-r | Read packets from a saved file instead of capturing live traffic. |
-s | Capture only N bytes per packet. Use -s0 for the entire packet. |
-w | Write packets to a .pcap file for later analysis. |
-c | Stop after capturing N packets. |
-v, -vv, -vvv | Increase verbosity and detail in output. |
-X | Show packet contents in both hex and ASCII. |
-t, -tttt | Control timestamp display format. |
-S | Print absolute TCP sequence numbers. |
-q | Display minimal protocol information (quiet mode). |
-C | Split files after reaching specified size (MB). |
-G | Rotate capture files every N seconds. |
-W | Limit the number of rotated files kept. |
3. Real-World Tcpdump Examples (With Explanations)
🖥️ Capture Traffic on a Specific Interface
tcpdump -i ens160
👉 Captures all traffic passing through interface ens160.
Use this when monitoring a specific NIC on a multi-interface system.
tcpdump -i any
👉 Captures packets from all interfaces simultaneously — useful for systems with multiple network connections (like containers or VMs).
🎯 Capture Packets for a Specific Host
tcpdump -i ens160 -c 5 host 140.240.61.21
👉 Captures 5 packets to/from IP 140.240.61.21 on interface ens160.
This is a targeted snapshot — great for verifying whether communication with that IP is working correctly.
🔌 Capture Packets on a Specific Port
tcpdump -i any port 8000
👉 Captures all traffic using port 8000 (commonly used by web apps or APIs).
Use this to confirm whether your application is actually receiving requests.
💾 Write Captured Packets to a File
tcpdump -c 5 -w network_file_linux.pcap -i any
👉 Saves the first 5 packets into a .pcap file.
You can later analyze it using tools like Wireshark.
This is ideal for long-term diagnostics or offline analysis.
📡 Capture Packets from a Specific Protocol
tcpdump -i ens160 -c 5 -nn tcp
👉 Captures 5 TCP packets, without resolving names (-nn), so you see raw IPs and port numbers.
Useful when you want quick raw data for technical analysis.
🧭 Filter by Source or Destination Host
tcpdump src 100.10.8.121
tcpdump dst 14.211.62.121
👉 The first command captures packets originating from a host; the second captures packets targeting one.
This helps when diagnosing asymmetric communication (e.g., packets sent but not received).
🔄 Rotate Capture Files Automatically
tcpdump -i ens160 -w /tmp/network-%H-%M.pcap -W 48 -G 300 -C 100
👉 Rotates files every 5 minutes (-G 300), each capped at 100 MB, keeping up to 48 files.
Perfect for continuous monitoring without filling your disk.
Another example:
tcpdump -G 100 -W 3 -w network-%H-%M.pcap port 19096
Creates files like:
network-17-08.pcap
network-17-09.pcap
network-17-11.pcap
👉 Each file covers 100 seconds of traffic on port 19096 — a manageable way to segment long captures.
🌍 Capture Traffic from Multiple Hosts
tcpdump src 192.168.0.10 or src 192.168.0.11
👉 Captures packets sent from either of the two IPs.
Helpful for monitoring traffic across servers in the same cluster.
⚓ Capture Multiple Ports
tcpdump -i eth0 port 22 or port 9402
👉 Monitors both SSH (22) and application port 9402 simultaneously.
Perfect when debugging systems that use multiple services.
🧪 Combine Filters
tcpdump -i eth0 arp or icmp and host 192.168.0.10
👉 Captures ARP or ICMP traffic, but only related to the host 192.168.0.10.
This is excellent for troubleshooting basic network connectivity and address resolution issues.
🧠 Pro-Level Combination Example
tcpdump -i any -n -s0 -w capture.pcap 'tcp and (port 22 or port 443)'
👉 Captures all TCP packets on ports 22 and 443 across all interfaces, writes them to a .pcap file, and disables hostname resolution for cleaner output.
This is a standard template for real-world monitoring or forensic analysis.
4. Tcpdump Command Options — Quick Summary
| Option | Meaning |
|---|---|
-i | Choose which interface to listen on |
-n, -nn | Disable hostname and service name resolution |
-t, -tttt | Show timestamps in human-readable format |
-X | Display packet payloads in ASCII + hex |
-v, -vv, -vvv | Increase verbosity for more detail |
-c | Limit packet count |
-s | Capture length per packet |
-S | Show full sequence numbers |
-q | Less protocol info (quiet output) |
-w | Save output to file |
-C, -G, -W | Control file size, rotation interval, and file count |
5. Conclusion
Tcpdump may look intimidating, but it’s one of the most efficient and reliable tools for network troubleshooting once you learn to use filters effectively.
- Keyword filters help isolate basic sources and destinations.
- Expression filters let you combine multiple conditions.
- Protocol filters let you focus on specific types of traffic.
And with the right options (-i, -n, -w, -c, -G), you can fine-tune tcpdump for both quick diagnostics and continuous monitoring.
Whether you’re debugging dropped packets, verifying firewall rules, or investigating latency — tcpdump gives you complete visibility, one packet at a time.
Related Post: