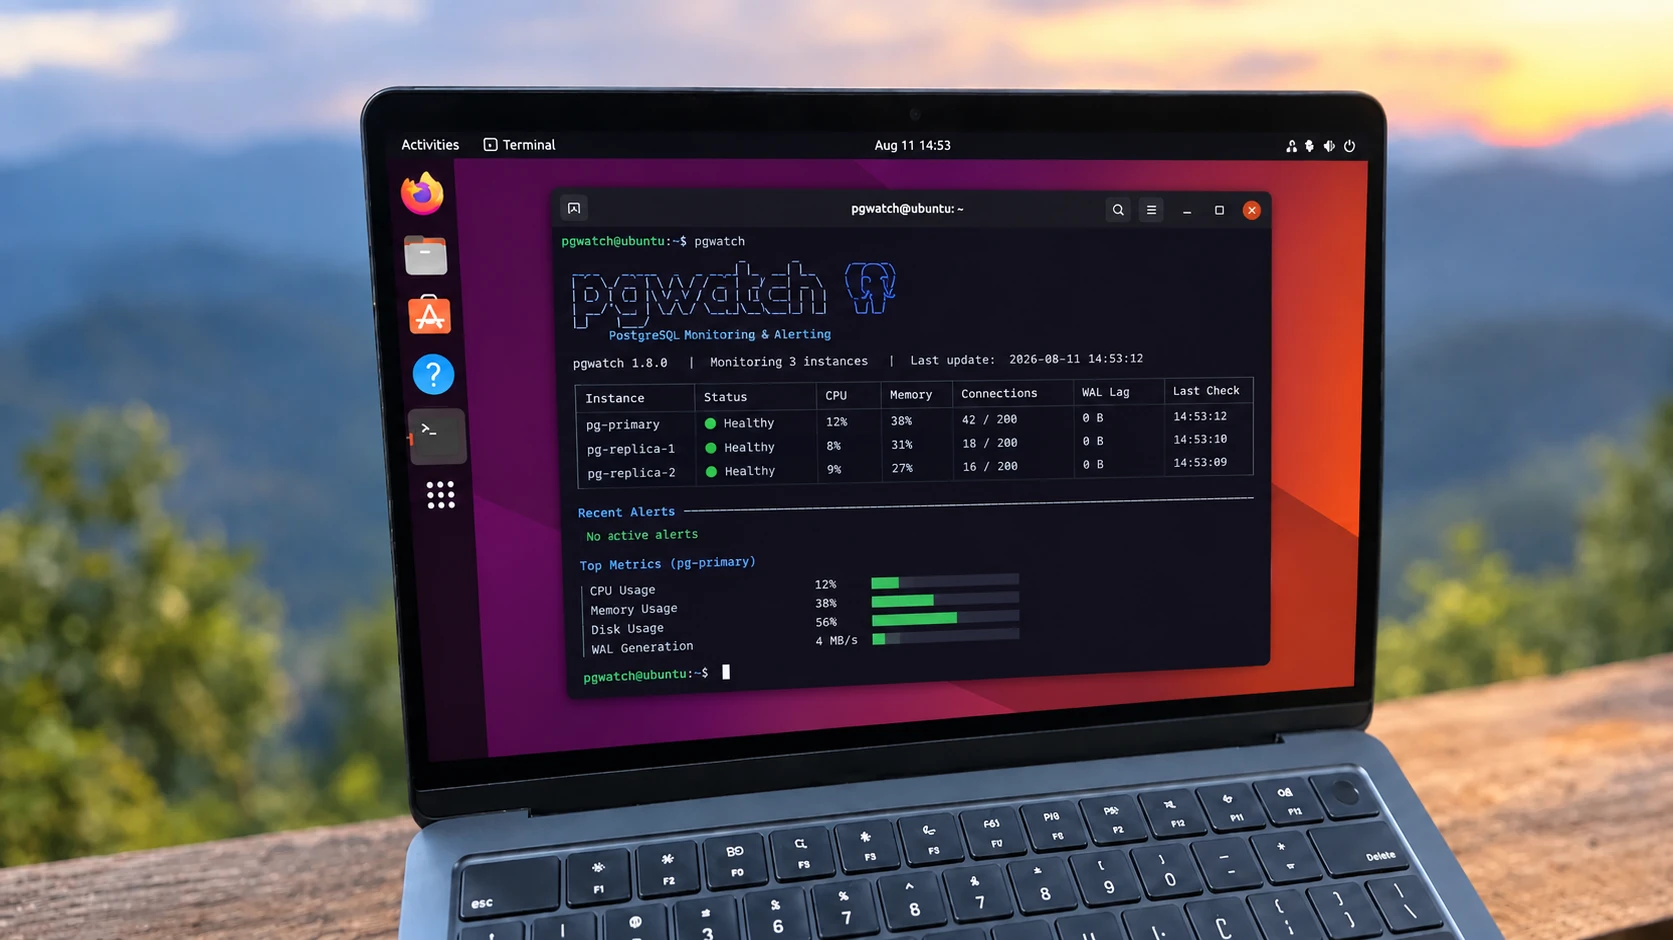
CYBERTEC released pgwatch 6.0 this month, the biggest update since version 5 of its open-source PostgreSQL monitoring tool. It adds support for PostgreSQL 19, can now pull metrics from Prometheus exporters, and comes with rebuilt Grafana dashboards. The most important change, though, is a rewrite of the part that actually collects metrics.
Table of Contents
Why the collector had to change
pgwatch works by connecting to your databases, running SQL queries on a schedule, and storing the results for Grafana to chart. The component that does the polling is called the reaper.
Until now, the reaper started a separate goroutine for every combination of database and metric. Monitor a handful of servers with dozens of metrics each, and you end up with hundreds of goroutines, each running its own timer and its own round-trip to the database. Worse, when one database stopped responding, work could pile up behind it, and the usual fix was restarting pgwatch.
In 6.0, the reaper runs one goroutine per database instead:
pgwatch 5:  one goroutine per database × metric, one query each
pgwatch 6:  one goroutine per database
              ↓ shared tick
            every metric that's due, sent in a single batched round-trip
The project’s own six-database test shows the difference. The new design removes 414 goroutines, cuts steady-state memory allocation by 8 to 9 times, and reduces garbage-collection CPU usage by about 3 times.
The resilience fixes matter just as much. Every database call now has a deadline, sources are refreshed at most 32 at a time, and if automatic discovery of new databases fails, pgwatch keeps using the last list that worked. In practice, a single hung server can no longer stall monitoring for everything else.
Prometheus goes from output to input
pgwatch has long been able to send its metrics to Prometheus. Version 6.0 works the other way too: it can scrape existing Prometheus endpoints such as Patroni and postgres_exporter, and treat them as sources alongside regular PostgreSQL connections.
That’s useful if you already run exporters across your fleet. Instead of opening another set of direct database connections, pgwatch can reuse the metrics you’re already collecting and show them in the same dashboards. The Prometheus dashboards now match the native ones, including new views for lock details, server log events, and stored procedures.
All dashboards were rebuilt for Grafana’s v13 dashboard format, and the old Grafana v11 dashboards were removed because that release is end-of-life. Check your Grafana version before upgrading.
A security fix worth upgrading for
One line in the changelog deserves more attention than it gets: the web UI’s JWT signing secret used to be hardcoded. pgwatch now generates a random secret every time it starts.
See also: Mastering the Linux Command Line — Your Complete Free Training Guide
If you expose the pgwatch web UI on a network anyone else can reach, that alone is a good reason to move to 6.0. One side effect: because the secret changes on every restart, existing UI login sessions will need to sign in again afterward.
The release also adds new metrics for recovery status, lock statistics, and autovacuum scoring, and it fixes deadlocks in the source reaper and a crash-prone handling of NaN and infinity values in measurements. The documentation covers installation and upgrade paths.